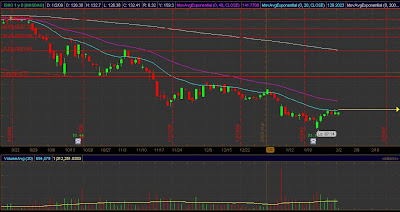
- The other day I put on a bearish directional spread on ISRG. This trade ended up being a loser, but reviewing the thinking behind the trade can be quite helpful and instructional. Now is a good time to review some of my rules for these spreads. As one might expect, these are directional, so they begin with a look at the chart. On the day I entered this trade, this was the pattern chart that I saw. While there are stronger patterns out there, this one is fairly clean. ISRG is in a nice down trend, making lower highs and lower lows. It's currently curling over at the top of the channel, bouncing nicely off the 20 day moving average.

Once I form an opinion about the direction of the trade, the next thing I do is pick a stop. In this case, the obvious point is right above the recent high, at about $107. My theory is that the pattern will continue down. If ISRG makes a new high above $107, my theory is wrong and I'll get out. Aside from my opinion about the stock's chart, there are two other factors that go into my decision about directional trades... the overall market direction, and my current portfolio requirements.
The Market: I like to enter directional trades with some inkling of what the market overall might do. As a proxy for "the market" I usually watch the good ole' SPX, like most people.
Portfolio Position: Specifically, I look at my overall portfolio deltas relative to my beliefs about the market as a whole. In this particular case I need some short deltas. I have taken several bearish trades off profitably and now my deltas are leaning a little long. As you know, under the current market conditions we can experience violent downswings, and I don’t want to be caught on the wrong side of that; so, I’m constantly evaluating my portfolio deltas and looking to keep them fairly balanced. I don’t mind leaning a little one way or the other if I believe we are in for a move in that direction, but I still like to keep a little hedge on.
Risk/Reward: This might be the most critical part of my analysis, and in this particular case, it is spectacular. I will talk more about this in an upcoming section, but in this case the risk if my stop was hit (at $107) was $40 per contract, but the credit and potential profit was $190. More than 4:1 ratio. The minimum I look for in this kind of trade is 2:1, so this one was great.
This is not the best technical setup that I trade on, but it’s not bad. I believe it’s better than 50% accurate, but the point is, it doesn’t matter. I could be wrong 75% of the time and, although it wouldn’t be fun, it would still be profitable! That’s remarkable. This is why I only take trades that are at least 2:1 risk/reward, and often look for better than that. Frankly, I don’t normally hold these spreads until expiration, and would probably buy it back with around $120 to $150 profit. Still, this is a great ratio and I would take trades like this all day long.
Quick Review:
- Setup: nice downtrend and at the top of the channel… pretty classic.
- Market: Not really sure in the short term… we might be in for a little bounce, but we’re clearly in a bear market.
- Portfolio: Need shorts.
- Risk/Reward: As good as it gets.
There is one final step that I take, which is more related to stock trades than indices or ETFs. I take a quick look for anything that might cause a surprise gap, such as earnings. That’s the one thing that can hurt us spread traders. This whole process, while it sounds lengthy, take less than 5 minutes. Once you do anything a lot it gets pretty easy.
Next Time: Executing the Trade
Good Trading…
No comments:
Post a Comment